
Inclusionary housing and the limits of market-led spatial restructuring in Stellenbosch municipality
A critical socio-spatial assessment of the Adam Tas corridor and land value capture strategy.
Executive summary
This report assesses the Adam Tas corridor (ATC) inclusionary housing strategy against the wider demographic, housing-market and settlement structure of Stellenbosch municipality. Its argument is deliberately balanced. The Development Action Group (DAG) and Stellenbosch municipality have documented1Development Action Group, 2025 Stellenbosch’s Inclusionary Zoning Policy: Lessons and Insights on Policy Development, pp. 2-4 on policy parameters; pp. 17-22 on the Adam Tas Corridor and land value capture; pp. 35-47 on adoption, implementation and monitoring. an important planning innovation: the use of land value capture and inclusionary zoning to link increased development rights to affordable housing obligations. In principle, this is a significant break from the post-apartheid pattern in which low-income housing is pushed to the urban periphery while high-value, well-located land remains reserved for upper-income residential and commercial development.

Graphic of the ATC
The difficulty is that the policy innovation should not be confused with a housing solution at scale. The available evidence suggests that the inclusionary housing units so far realised or planned within the practical orbit of the Adam Tas strategy are priced largely in the R850 000 to R1,2 million range. This makes them relevant mainly to formally employed lower-middle-income households able to access mortgage finance and, in some cases, First Home Finance2First Home Finance is the South African government subsidy for first-time buyers. support. That is a real group with genuine housing needs, but it is not the majority of Stellenbosch households experiencing the sharpest housing stress.
For this reason the report places four empirical baselines at the front.
• Table 1 reconstructs Stellenbosch’s housing system by disaggregating formal market segments and analysing the proportion of households that can afford access to each of these segments. The numbers of households in each segment is derived from the total Stellenbosch population according to the 2022 Census.
• Table 2 enumerates formal and informal housing typologies, including backyard rental and free-standing informal settlements, because some households occupying existing formal housing might have a need for extra housing due to overcrowding, and a significant proportion of Stellenbosch households are accommodated informally and informal housing is a specific expression of housing need.
• Table 3 estimates the population residing in the five areas identified, as well as the total population in respectively informal structures in backyards and in free-stranding informal settlements.
• Table 4 estimates overcrowding by translating settlement populations and estimated (formal and informal) dwelling numbers into floor-space per person.
The method to determine overcrowding is transparent: it uses a conservative working assumption of 40 and 55 square metres per unit, then compares actual estimated floor space to a minimum non-overcrowded benchmark of 20 square metres per person. The result is a rough but useful estimate of the additional floor area, and the equivalent number of 40 square metre units, required to move major lower-income settlements above the overcrowding threshold.
The results are stark. Even under conservative assumptions that probably overstate the floor area of many backyard and informal structures, Kayamandi (including Enkanini and Azania free-standing informal settlements), Klapmuts and Langrug/Groendal fall within severe to moderate overcrowding bands. Cloetesville and Idas Valley also show material crowding. Against this background, the Adam Tas inclusionary housing strategy is best understood as a progressive spatial intervention with limited socio-economic reach, rather than as a central response to the municipality’s deeper affordable housing and overcrowding crisis.
Baseline Tables
The four tables below are placed upfront because they establish the empirical baseline against which the ATC strategy must be assessed. They should be read as analytical estimates, not as official municipal enumerations. Where direct data was not publicly available, the tables use transparent inference from published population, housing-market and settlement sources.
Table 1: Stellenbosch municipality housing market segments, and their socio-spatial distribution (2022-adjusted)
| Segment.3Western Cape Government/Centre for Affordable Housing Finance in Africa, 2022 Stellenbosch Town Housing Market Study (STHMS). The percentages of households within broad income bands are derived from the comparative household-income distributions presented on page 63 of the STHMS, which compares estimates from GeoTerraImage (GTI) and the Western Cape Department of Economic Development and Tourism (WC DEDT). The STHMS itself defines the housing market price bands on page 54. | Price band. | Income/affordability band.4This table aligns the income-distribution structures from the STHMS as closely as possible with analytically inferred affordability thresholds derived from standard mortgage affordability assumptions. The inferred affordability thresholds were based on the following assumptions:• Mortgage repayment period: 20 years; • Interest rate: approximately prime-linked mortgage rates prevailing around the period of the STHMS; • Maximum repayment-to-income ratio: approximately 30 per cent of gross monthly household income; • Deposit assumption: approximately 10 per cent; • Transfer costs excluded from the initial threshold calculations.Using these assumptions, approximate monthly household incomes required to access the various market segments were inferred from the housing price bands defined in the STHMS. Because the income-band categories used in the GTI and WC DEDT datasets do not correspond perfectly with the analytically inferred affordability thresholds, the two structures were aligned as closely as possible. The resulting percentages and household estimates should therefore be understood as approximations derived through analytical alignment rather than directly observed Census categories. |
Affordability of households.5See footnote 1 | Dominant tenure. | Spatial concentration.6Spatial concentrations are based on the author’s knowledge of the housing market segments in these areas. South African Affordable Residential Developers Association (SAARDA), 2023 Largest development launched as first urban inclusionary initiative in Stellenbosch, refers to Newinbosch inclusionary housing implementation and pricing. |
| Luxury. | Above R1,2m. | Above R29 600 per month (p.m.) | 19 per cent. | Outright and sectional title ownership. | Onderpapegaaiberg, Paradyskloof, Brandwacht, Mostertsdrift, Dalsig suburbs and gated estates. |
| High-end. | R900 000-R1,2m. | R22 200-R29 600 p.m. | 4 per cent. | Outright and sectional title ownership. | Newinbosch/ATC, The Ridge (Idas Valley), etc. |
| Conventional. | R600 000 – R900 000. | R14 750-R22 000 p.m. | 4 to 5 per cent. | Outright and sectional title ownership. | Idas Valley affordable housing project section (2019). |
| Affordable. | R300 000-R600 000. | R7 300-R14 750 p.m. | 15 per cent. | Outright ownership. | Parts of Cloetesville, Idas Valley, Klapmuts and older formal township areas. |
| Entry (original township formal housing and RDP7Reconstruction and Development Programme 40 square metre units, over 2 million of which were delivered between 1994 and 2020, fully subsidised by government./BNG 8Breaking New Ground was the name of the new housing policy adopted in 2004 to address shortcomings of the initial RDP programme, and the units built to a higher level of finishing were referred to as BNG units. stock). | Below R300 000 or non-market (i.e. persistent owner occupation). | Below R7 300 p.m. | 54 per cent.9A significant number of these households are residing in informal structures (see Table 2). | Outright ownership and small scale landlordism (informal rental). | Kayamandi, Groendal, farm settlements, lower-income Klapmuts, parts of Cloetesville and Idas Valley. |
Table 2: Stellenbosch municipality informal and entry/affordable formal housing units, and socio-spatial distribution (2022-adjusted)
| Formal/informal housing type. | Income band. | Affordable price. | Estimated numbers of units. | Dominant tenure. | Spatial concentration. |
| Formal brick-and-mortar units. | Probably a range below R22 000, with majority below R7 300 p.m. | Probably a range below R900 000 with majority below R300 000. | 800 | Probably owner occupation. | Groendal/La Motte10Stellenbosch Municipality, (undated) Groendal GIS cadastral map. |
| 1 096 | Khayamandi 11Stellenbosch Municipality, (undated) Khayamandi 1 and Khayamandi 2 GIS maps. | ||||
| 1 210 | Cloetesville12Stellenbosch Municipality, (undated) Cloetesville 1 and Cloetesville 2 GIS maps. | ||||
| 1 900 | Idas Valley13Stellenbosch Municipality, (undated) Idas Valley 1, Idas Valley 2 and Idas Valley 3 GIS maps | ||||
| 1 032 | Klapmuts14Stellenbosch Municipality, (undated) Klapmuts GIS map | ||||
| Backyard shacks or rooms behind formal township houses. | Likely below R7 300 p.m., precarious, informal earnings and social grants. | Some Stellenbosch backyard rentals range from R800–R2 500.15Steyn, D and Mokoena, V 2022 Stellenbosch backyarders threaten to occupy golf course, Groundup. | 3 58516Available municipal and municipal-commissioned survey evidence identifies at least 3,585 backyard residential households/dwellings in Kayamandi, Klapmuts and Idas Valley alone. Because this subtotal excludes unquantified backyard dwellings in Cloetesville/Smartie Town, Groendal/Mooiwater and other lower-income areas, this is a conservative working estimate pending access to the Cloetesville and Groendal survey data. The strongest evidence is the following. Stellenbosch Municipality, 2021 2020/21 Annual Report, pages 216 and 217 (Table 150 – Kayamandi: 1 629 backyard households; Table 151 – Klapmuts: 1 626 backyard households); and, Stellenbosch Human Settlements Committee Meeting, 2019 Demographic Survey of Backyard Dwellers of Idas Valley, page 76 (330 Idas Valley informal backyard structures surveyed). | Informal rental | Kayamandi, Cloetesville, Idas Valley, Klapmuts and Groendal/La Motte. |
| Shacks in free-standing informal settlements. | No rental/occupational price available. Informal settlements contain active rental markets,17Gunter, A 2014 Renting shacks: Landlords and tenants in the informal housing sector in Johannesburg South Africa, University of South Africa. and Azania is no exception.18Sithole, SK 2025 Informal enterprise incubation in newly established informal settlements and its interaction with regulatory urban planning practice and retail by-laws: The case of Azania settlement in Kayamandi, Stellenbosch, University of Stellenbosch. (The information was retrieved during the preparation of this report and incorporated into the analytical tables. At the time of final editing the Stellenbosch University site was temporarily inaccessible and therefore the information could not be re-verified online). |
9 00019The evidentiary chain for the estimate of free-standing informal settlement structures municipality-wide is inferential and cumulative rather than derived from a single official enumeration. The estimate was constructed by combining direct settlement-specific household estimates (as proxy for number of structures), later growth indicators, municipal/NGO references to additional smaller settlements, and evidence of continued settlement expansion. The strongest identifiable evidentiary components are the following. |
Informal owner occupation or rental. | Enkanini,20Swilling, M et al 2013 Rethinking Incremental Urbanism: co-production of incremental informal settlement upgrading strategies (Enkanini informal settlement discussion paper), especially pp. 4-9 for Enkanini household and settlement estimates. Azania, Langrug,21South African SDI Alliance, 2011 Langrug Enumeration Report, especially pp. 5-17 for Langrug household and settlement enumeration data. plus smaller settlements such as Emaholweni, Mandela City, Khwezi and Strongyard.22DAG, 2023 Asivikelane submission of inputs for Stellenbosch Municipality’s Draft 2023/24 Budget, page 3. |
The total number of units from the above table is 18 623.
Table 1 shows why the Adam Tas Corridor cannot be evaluated only as a planning instrument. It must be read against the full municipal housing system. The high-end affordable band into which inclusionary units fall is a narrow segment of the municipality’s households. By contrast, the majority of households fall below the income levels required for mortgage-linked ownership at R850 000-R1,2 million and are accommodated through subsidy-linked formal housing, backyard rental and informal settlement occupation, as indicated in Table 2.
Table 2 also provides a count of formal housing units in Klapmuts, Khayamandi, Cloetesviile, Idas Valley and Groendal, originating from the previous apartheid regime’s policies and augmented by delivery of RDP/BNG and a limited number of private developer housing units after 1994.
Table 3 gives the estimated population for each of the five areas identified as well as in respect of informal backyard and free-standing settlement housing.
Table 3: Estimated population residing in specific (a) formal areas and (b) informal housing structures.
(a)
| Township. | Census 2011 population.23Population estimates for Khayamandi, Cloetesville, Idas Valley and Klapmuts were derived from the Adrian Frith Census 2011 database, which reproduces Statistics South Africa Census 2011 place-level data. The figures were retrieved during the preparation of this report and incorporated into the analytical tables. At the time of final editing the Adrian Frith site was temporarily inaccessible and therefore the figures could not be re-verified online. The figures should therefore be treated as Census-2011-derived estimates pending confirmation from Stats SA Community Profiles or SuperCROSS outputs. | Estimated 2022 population.24Growth factor: 1,126 derived from Stellenbosch municipal population growth from 155,733 (2011) to 175,411 (2022). Cf. Wikipedia, (undated) Stellenbosch local municipality – sub-heading: Demographics. |
| Khayamandi.25Frith, A (undated) Khayamandi population. | 24,645. | 27,751. |
| Cloetesville.26Frith, A (undated) Cloetesville population. | 15,390. | 17,329. |
| Idas Valley.27Frith, A (undated) Idas Valley Population. | 8,762. | 9,866 |
| Klapmuts.28Frith, A (undated) Klapmuts population. | 7,703. | 8,674. |
| Groendal / La Motte.29Changeability, (undated) The Communities we serve. | 7,520. | 8,468. |
| TOTAL. | 64,020. | 72,088. |
(b)
| Location of Informal structures. | Estimated Number of households.30Assuming one household per informal structure. | Estimated Number of persons.31Assuming four persons per household. |
| Free standing settlements (Enkanini, Azania Langrug, etc). | 9 000. | 36 000. |
| Backyard structures (Khayamandi, Cloetesville, Idas Valley, Klapmuts and Groendal/La Motte). | 3 585. | 14 340. |
| TOTAL. | 12 585. | 50 340. |
The total number of informal and formal housing units in and around the above five townships is estimated as 18 623, within which the population of 122 428 is accommodated. Assuming an average floor area for each unit and dividing the total floor area by the total population per area will give us an average floor area occupational density. The threshold for overcrowding is 20 square meters of floor space per person.32Notes on assumptions and the 20m² adequacy benchmark:
*Formal township housing units are assumed to average 55m². This reflects the likelihood that many older formal township houses have been extended over time, while some newer RDP/BNG-type units remain closer to 40m². The 55m² figure is therefore used as an analytical average for formal housing stock.
*Backyard structures and free-standing informal settlement structures are assumed to average 40m². This is deliberately generous for informal structures and therefore likely understates, rather than overstates, actual overcrowding.
*World Health Organisation (WHO) recognises floor area per person as one legitimate measure of household crowding. Cf. WHO Housing and Health Guidelines, Chapter 3: Household crowding. WHO does not prescribe a universal floor-space threshold, but it explicitly recognises crowding as a condition where occupants exceed the dwelling space available, including as measured by floor area.
*Housing-health literature associated with the WHO housing-health field identifies floor-area crowding thresholds around 20m² per person, including less than 20m² per person in Germany, less than 21m² per capita in Russia, and Polish categories below 10m² and above 20m² per person. Cf. Lorentzen, JC Johanson, G Björk, F and Stensson, S 2022 “Overcrowding and Hazardous Dwelling Condition Characteristics: A Systematic Search and Scoping Review of Relevance for Health.” International Journal of Environmental Research and Public Health, 19(23), 15542. See the review of crowding definitions and thresholds, Table 2B.
WHO recognises floor area as one measure of crowding and recommends that implementing agencies select context-appropriate crowding measures and thresholds.
*Statistics Sweden, “Sociodemographic inequalities in Sweden”, gives the clearest official threshold: it defines residential overcrowding as living with less than 20m² per person. Statistics Sweden. “Sociodemographic inequalities in Sweden.”
*This study therefore adopts 20m² per person as an adequacy benchmark for estimating the scale of floor-space deficit.
Table 4 analyses the extent of overcrowding of RDP/BNG stock and informal housing.
Table 4: Occupational Density and Estimated Housing Deficit
33Note on data sources: Population, formal-unit, backyard-unit and informal-settlement-unit figures are drawn from Tables 1-3 of the paper and are not re-referenced here. New source references are provided only for the 20m² per-person benchmark and the measurement method for crowding.| Area/housing type. | Population. | Units. | Assumed unit size (m²). | Floor area (m²).34Calculation method: Floor area equals units multiplied by the assumed average unit size. | m²/person.35Calculation method: Occupational density equals total floor area divided by population. | Reading. | Additional 40m² units required.36Calculation method: Additional 40m² units required are calculated as ((population x 20m²) minus current floor area) divided by 40m², rounded up to the nearest whole unit. The total additional-unit figure is the sum of the row-level requirements, which preserves the separate housing-category calculations. |
| Khayamandi formal housing. | 27,751. | 1,096. | 55. | 60,280. | 2.17. | Extreme overcrowding. | 12,369. |
| Cloetesville formal housing. | 17,329. | 1,210. | 55. | 66,550. | 3.84. | Extreme overcrowding. | 7,001. |
| Idas Valley formal housing. | 9,866. | 1,900. | 55. | 104,500. | 10.59. | Moderate overcrowding. | 2,321. |
| Klapmuts formal housing. | 8,674. | 1,032. | 55. | 56,760. | 6.54. | Severe overcrowding. | 2,918. |
| Groendal/La Motte formal housing. | 8,468. | 800. | 55. | 44,000. | 5.20. | Severe overcrowding. | 3,134. |
| Backyard structures (consolidated). | 14,340. | 3,585. | 40. | 143,400. | 10.00. | Moderate overcrowding. | 3,585. |
| Free-standing informal settlements (consolidated). | 36,000. | 9,000. | 40. | 360,000. | 10.00 | Moderate overcrowding. | 9,000. |
| TOTAL / AVERAGE. | 122,428. | 18,623. | – | 835,490. | 6.82. | Severe overcrowding overall. | 40,328. |
The additional units do not prescribe a single housing solution; it quantifies the order of magnitude of spatial shortage. This does not mean that every intervention must be a 40 square metre ownership unit. It does mean that the scale of floor-space deficit is vastly larger than the number of inclusionary ownership units currently associated with the Adam Tas strategy.
1. Introduction: why the baseline matters
The Adam Tas corridor is an important planning initiative because it seeks to use the municipal land-use system to correct, at least in part, the spatial exclusions created by apartheid planning and reproduced by post-apartheid property markets. The corridor concept links rezoning, higher densities, mixed use, transport infrastructure and inclusionary housing obligations. In principle, this is exactly the type of spatial planning instrument needed in a municipality where well-located land has become increasingly inaccessible to ordinary working households.
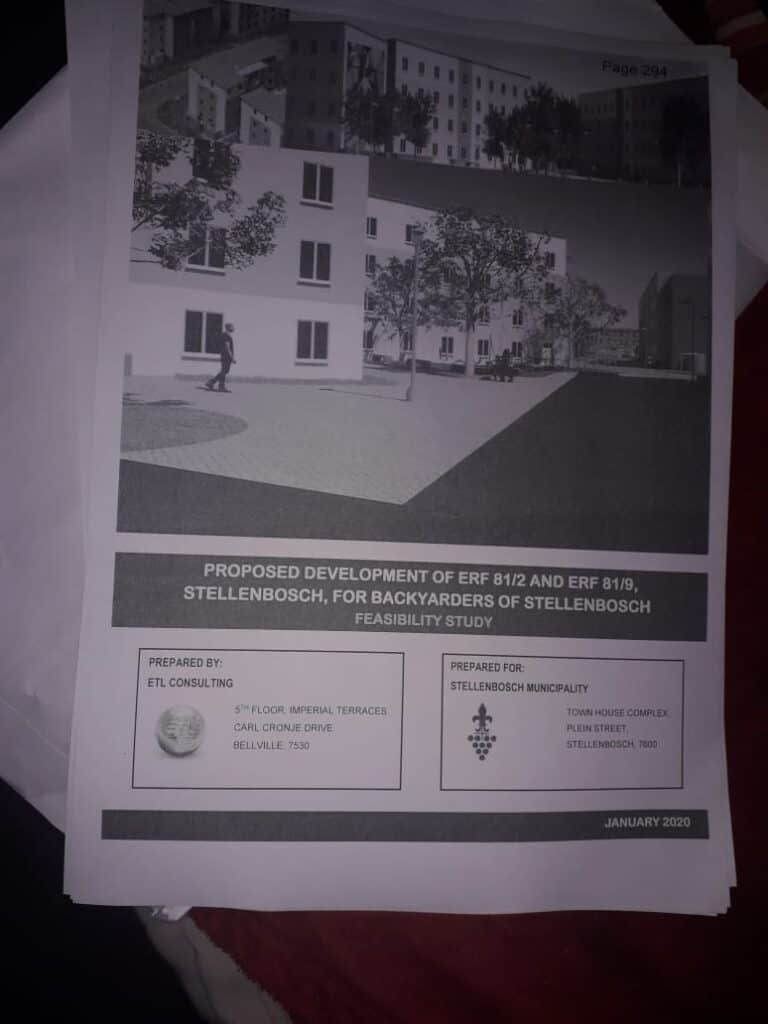
Proposed development for ‘backyarders’ in the ATC.
Yet a policy can be progressive in form and still limited in social reach. The key question is not whether inclusionary zoning is a good idea in principle. It is whether the specific affordability band, unit output and spatial implementation of the Adam Tas strategy are commensurate with the structure of housing need in Stellenbosch municipality. The tables above therefore frame the whole paper. They show that the inclusionary ownership market is only one component of a larger housing system dominated, at the lower end, by overcrowding, backyard rental and informal settlement occupation.
This framing is important because the language of ‘affordable housing’ can obscure substantial differences between income groups. A household able to buy a unit priced at R850 000-R1,2 million is in a very different position from a household renting a backyard shack, occupying an informal settlement structure, or sharing overcrowded space in a formal township dwelling. All may be excluded from the luxury market, but they are not equally placed in the housing system. A critical assessment of the Adam Tas strategy must therefore ask which excluded group the policy actually reaches, and which groups remain outside its effective affordability boundary.
2. Demographics, market segmentation and spatial inequality
Stellenbosch Municipality had an estimated 175 411 residents in 2022, compared with 155 733 in Census 2011. The growth is not evenly distributed across the municipal area. It is concentrated in and around lower-income settlements, farm-worker communities, informal settlements and labour-receiving areas, while the formal upper-end market remains geographically concentrated in historically advantaged suburbs and newer gated or estate developments.
The Stellenbosch Town Housing Market Study (see endnote 3) is central because it allows the municipality’s housing problem to be translated into market segments. It separates the housing market into entry, affordable, conventional, high-end and luxury categories, and relates those categories to household income. Once this is done, the core contradiction becomes visible: the units described as affordable within the Adam Tas and Newinbosch context are affordable only to a relatively narrow band of households. The R850 000-R1,2 million band requires mortgage-linked purchasing power and therefore excludes the majority of low-income households.
The spatial pattern follows the income pattern. Upper-income households are concentrated in areas such as Onderpapegaaiberg, Paradyskloof, Brandwacht, Dalsig and Mostertsdrift. Lower-income households are concentrated in Kayamandi, Cloetesville, Idas Valley, Klapmuts, Groendal and farm settlements. These are not merely different residential preferences. They reflect a durable spatial hierarchy in which land value, race, income and access to urban opportunity remain tightly linked. The Adam Tas Corridor is significant because it seeks to intervene in this hierarchy; its limitation is that the market-linked inclusionary mechanism cannot by itself reach the majority of households most affected by the hierarchy.
3. Housing typologies and the meaning of overcrowding
The municipality’s low-income housing system is not exhausted by the categories of formal housing and informal settlements. It includes at least three overlapping shelter systems: formal township dwellings, backyard informal rental structures, and free-standing informal settlements. These systems are connected. When formal housing is insufficient, additional households are absorbed through backyard construction. When backyard rental becomes saturated or unaffordable, households move to or remain in informal settlements. When neither option is available, extended families share formal units beyond their intended capacity.
For this reason, overcrowding is a crucial indicator. It captures the lived housing deficit more directly than a simple count of housing units. A household may occupy a formal structure and yet be severely overcrowded. Conversely, an informal settlement structure may house fewer people but provide extremely limited floor area and inadequate services. Floor-space per person therefore allows different housing forms to be compared through a common metric.
The literature does not provide a single universal standard, but WHO and UN-Habitat37UN-Habitat/UN Statistics Division, 2021 SDG Indicator 11.1.1 metadata, p. 9 on overcrowding and minimum living area; see also WHO Housing and Health Guidelines, Chapter 3 on household crowding. recognise overcrowding as a condition in which the number of people exceeds the capacity of the dwelling space available, measured either by rooms, bedrooms or floor area. UN SDG indicator metadata uses a minimum of four square metres per person in its slum/informal settlement tracking, while broader housing-quality literature treats substantially higher floor-space norms as necessary for adequate housing. For the purposes of this report, 20 square metres per person is used as a cautious non-overcrowded benchmark. This is not a luxury standard. It is a minimum adequacy benchmark that allows the analysis to quantify the gap between current crowding and minimally acceptable residential space.
The calculation is deliberately simple. Estimated units are multiplied by 40 or 55 square metres (depending on whether the housing type is formal or informal). The resulting floor area is divided by estimated population. The same population is then multiplied by 20 square metres to determine the floor area required to reach the non-overcrowded benchmark. The difference between required and estimated floor area is the additional floor-space deficit. Dividing that deficit by 40 square metres produces a unit-equivalent figure. This is a way of translating overcrowding into an understandable housing need estimate.
4. The Adam Tas Corridor and the LVC policy achievement
The DAG case study rightly emphasises the importance of the Adam Tas Corridor as a land value capture project. The municipality recognised that rezoning and infrastructure investment create value. If the state grants additional development rights without conditions, the resulting value uplift accrues largely to private landowners and developers. The inclusionary zoning policy seeks to redirect part of that publicly created value towards a public good: affordable housing.
This is an important institutional achievement. The policy creates a planning mechanism through which affordability obligations can be attached to development rights. Within the Adam Tas Corridor Overlay Zone, developments of 20 units or more are expected to provide a 30 per cent inclusionary housing contribution. In the rest of the designated municipal areas, the requirement is generally lower. The logic is coherent: where the municipality creates substantial additional land value, the public should share in that gain through housing inclusion.
The problem lies not in the logic of land value capture, but in the socio-economic reach of the resulting housing product. The first major realised example, Newinbosch, lies outside the core corridor and appears to have delivered or marketed about 114-144 inclusionary units linked to First Home Finance. These units are important, but their price band places them beyond the reach of the majority of households in the municipality. The policy therefore demonstrates a planning breakthrough, while the implementation demonstrates a social reach problem.
5. Droe Dyke, NIMBY resistance and state fragmentation
38Not in my backyard describes a suburban practice of resisting proximate lower income affordable residential developments, based on a perception of that such developments pose a risk to existing property values.The implementation gap is not only technical or financial. It is political. A public meeting was held in Onderpapegaaiberg in 2019, a suburb adjacent to the Adam Tas Corridor, at which the municipality’s planning leadership explained the corridor concept and associated affordable housing possibilities in the Droe Dyke area. Residents raised objections concerning road capacity, schools, public amenities and the possible effects of affordable housing near their neighbourhood.39Hendler, P 2019, personal notes of Onderpapegaaiberg residents meeting concerning the Adam Tas Corridor, Droe Dyke and affordable housing proposals. Personal notes, unpublished, no page pagination.
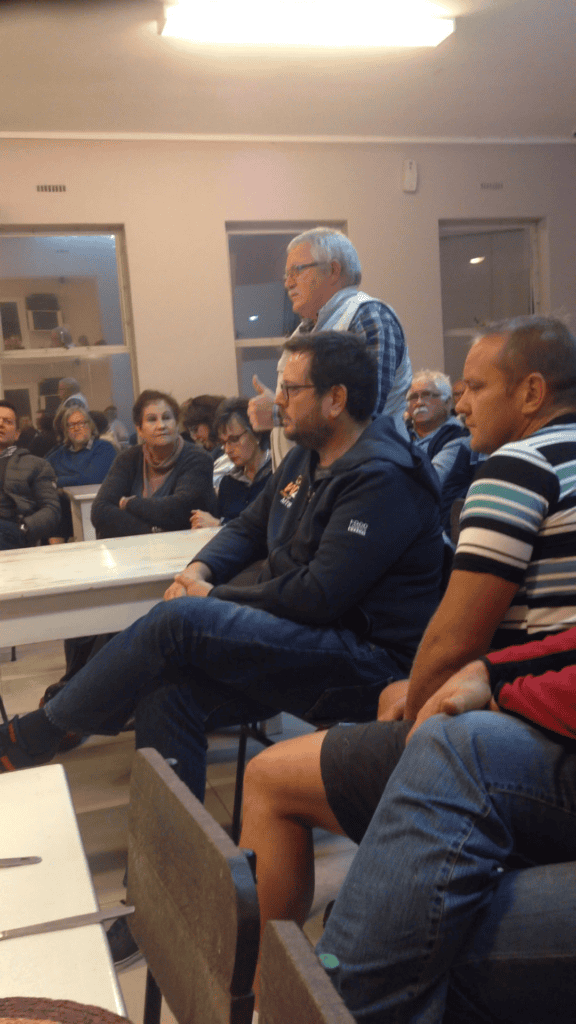
2019 Onderpapegaaieberg suburban meeting. SOURCE: own photo
Those objections cannot be dismissed automatically. Infrastructure capacity matters. Schools matter. Traffic matters. However, the pattern of objection is politically revealing. The same residents did not appear to mobilise in comparable fashion against mixed commercial and upper-income development planned around the old timber factory site. This contrast suggests that the objection was not simply to development, density or infrastructure pressure. It was, at least partly, a NIMBY response to affordable housing located too close to an established middle- and upper-income suburb.
The Droe Dyke site is therefore important. It lies within the wider spatial logic of the corridor and is close to road and rail infrastructure. It could, in principle, support a more directly inclusionary affordable housing project. Yet the proposed affordable housing development was stymied not only by suburban resistance but also by opposition from within the state, including the Department of Agriculture, whose property interests and agricultural land-use mandate conflicted with the municipality’s spatial restructuring objectives.40Stellenbosch Municipality, 2019, Municipal Spatial Development Framework, pp. 187-191 on comments and responses concerning Droe Dyke, agricultural research objections and the municipality’s response that the area was well situated for housing. This indicates a fragmented state unable to unify its own segments around a coherent affordable housing and spatial justice programme. The municipality may have had a progressive planning vision, but other state actors were not necessarily aligned with that vision.
6. Critical assessment: innovation without scale
The Adam Tas inclusionary housing strategy should therefore be assessed in two registers. In the first register, it is a genuine innovation. It uses planning law, development rights and land value capture to open a policy space for affordable housing in locations where market forces would otherwise exclude lower-income groups entirely. It demonstrates that municipalities can be more than passive regulators of private development.
In the second register, however, it is sharply limited. The affordability band of the actual and proposed units reaches only a narrow slice of Stellenbosch households. The key number is the high-end affordable group: approximately four per cent of households fall in the R900 000-R1,2 million affordability segment, with a somewhat broader but still limited band able to stretch into units priced around R850 000 with subsidy support. This is the segment most closely aligned with the inclusionary ownership product so far visible in Newinbosch and in the Adam Tas policy framework.
By contrast, the majority of households fall below the income required for such ownership. They are housed through formal township stock, backyard rental, informal settlement occupation and overcrowded family accommodation. The floor-space estimates show that the housing deficit in these areas is not marginal. To move Kayamandi alone towards 20 square metres per person would require an estimated 12 369 additional 40 square metre units. This dwarfs the inclusionary output currently visible.
The conclusion is not that inclusionary zoning is irrelevant. It is that it is insufficient. A policy that delivers a few hundred or even 1 200 mortgage-linked units cannot address a housing system in which thousands of households live in backyard structures and thousands more occupy free-standing informal settlements. Inclusionary housing may be symbolically powerful and spatially progressive, but it is not a substitute for social rental housing, deeper subsidies, serviced-site delivery, informal settlement upgrading, backyard rental regulation and public land release for genuinely low-income accommodation.
7. Conclusion
The Adam Tas Corridor strategy is one of the most important municipal spatial-planning experiments currently underway in South Africa. It should be recognised as such. It gives practical content to land value capture, uses municipal planning powers to extract public benefit from private development, and challenges the idea that high-value urban land must remain socially exclusive.
But the strategy also reveals the limits of market-led spatial restructuring. Its affordable housing product remains tied to mortgage affordability and therefore to formal lower-middle-income households. It does not reach the great majority of households whose need is expressed through overcrowding, backyard rental and informal settlement occupation. The deeper housing crisis in Stellenbosch is not simply a lack of ownership opportunities for the gap market. It is a crisis of space, income, tenure security and public intervention for low-income households.
The policy should therefore be understood as one instrument within a wider housing programme, not as the programme itself. Without a complementary strategy directed at low-income rental, informal settlement upgrading, backyard accommodation and overcrowding, the Adam Tas Corridor risks becoming a progressive plan whose benefits are real but socially narrow. The task is to retain the spatial ambition of the corridor while refusing to mistake a limited inclusionary ownership programme for a comprehensive response to Stellenbosch’s housing crisis.
Paul Hendler, Stellenbosch, 14 June 2026.
Annexure: Reconciliation of Stellenbosch Municipal Population Across Housing and Market Categories
| Step/category. | Population deducted. | Balance remaining. |
| Total Stellenbosch municipal population (Census 2022). | 175,411. | |
| Less: households with affordability access to luxury/high-end market segments (19%). | (33,328). | 142,083. |
| Less: population residing in the five identified township areas (Kayamandi, Cloetesville, Idas Valley, Klapmuts and Groendal/La Motte). | (72,088). | 69,995. |
| Less: population residing in free-standing informal settlements (Enkanini, Azania, Langrug and smaller settlements). | (36,000). | 33,995. |
| Less: population residing in estimated backyard rental accommodation. | (14,340). | 19,655. |
| Residual population not yet allocated to a housing category. | 19,655. |
Explanatory note
The purpose of this annexure is to provide a reasonableness check on the population and housing estimates used in the paper. It starts with the Census 2022 municipal population and then deducts the population assumed to fall into the luxury / high-end market-access category, the estimated population of the five identified township areas, the estimated free-standing informal settlement population, and the estimated backyard-structure population.
The residual figure of 19,655 persons should not be read as a precise enumeration of a distinct settlement category. It is the unallocated balance after applying the model used in Tables 1-4. It may include residents of lower-income formal areas not covered by the five township geographies, residents in farm settlements or smaller settlements not separately counted, and households in backyard structures not yet captured in the available survey evidence.
The residual is also consistent with known limitations in the evidence base. The backyard-structure estimate is conservative because the strongest publicly accessible counts relate to Kayamandi, Klapmuts and Idas Valley, while Cloetesville and Groendal / La Motte are less completely enumerated. The free-standing informal-settlement population may also be underestimated if average household size in some settlements exceeds the four-person assumption used in Table 3.
Accordingly, the residual should be interpreted not as an error, but as the margin of uncertainty in the population-allocation model. The fact that this residual is relatively modest in relation to the municipal total suggests that the model captures the broad scale of the municipality’s lower-income housing system, while also identifying where further empirical work would strengthen the analysis.
Source note
All figures in this annexure are drawn from Tables 1-3 of the paper. No new external empirical source is introduced in this annexure; the residual is an arithmetic result of the reconciliation calculation.
STATEMENT: During the preparation of this article the author used ChatGTP Plus in order to search for new information and data on the topic and to update his analysis. After using this tool/service, the author reviewed and edited the content as needed, checked source references for authenticity and takes full responsibility for the content of the publication.
Endnotes
- 1Development Action Group, 2025 Stellenbosch’s Inclusionary Zoning Policy: Lessons and Insights on Policy Development, pp. 2-4 on policy parameters; pp. 17-22 on the Adam Tas Corridor and land value capture; pp. 35-47 on adoption, implementation and monitoring.
- 2First Home Finance is the South African government subsidy for first-time buyers.
- 3Western Cape Government/Centre for Affordable Housing Finance in Africa, 2022 Stellenbosch Town Housing Market Study (STHMS). The percentages of households within broad income bands are derived from the comparative household-income distributions presented on page 63 of the STHMS, which compares estimates from GeoTerraImage (GTI) and the Western Cape Department of Economic Development and Tourism (WC DEDT). The STHMS itself defines the housing market price bands on page 54.
- 4This table aligns the income-distribution structures from the STHMS as closely as possible with analytically inferred affordability thresholds derived from standard mortgage affordability assumptions. The inferred affordability thresholds were based on the following assumptions:• Mortgage repayment period: 20 years;
• Interest rate: approximately prime-linked mortgage rates prevailing around the period of the STHMS;
• Maximum repayment-to-income ratio: approximately 30 per cent of gross monthly household income;
• Deposit assumption: approximately 10 per cent;
• Transfer costs excluded from the initial threshold calculations.Using these assumptions, approximate monthly household incomes required to access the various market segments were inferred from the housing price bands defined in the STHMS. Because the income-band categories used in the GTI and WC DEDT datasets do not correspond perfectly with the analytically inferred affordability thresholds, the two structures were aligned as closely as possible. The resulting percentages and household estimates should therefore be understood as approximations derived through analytical alignment rather than directly observed Census categories. - 5See footnote 1
- 6Spatial concentrations are based on the author’s knowledge of the housing market segments in these areas. South African Affordable Residential Developers Association (SAARDA), 2023 Largest development launched as first urban inclusionary initiative in Stellenbosch, refers to Newinbosch inclusionary housing implementation and pricing.
- 7Reconstruction and Development Programme 40 square metre units, over 2 million of which were delivered between 1994 and 2020, fully subsidised by government.
- 8Breaking New Ground was the name of the new housing policy adopted in 2004 to address shortcomings of the initial RDP programme, and the units built to a higher level of finishing were referred to as BNG units.
- 9A significant number of these households are residing in informal structures (see Table 2).
- 10Stellenbosch Municipality, (undated) Groendal GIS cadastral map.
- 11Stellenbosch Municipality, (undated) Khayamandi 1 and Khayamandi 2 GIS maps.
- 12Stellenbosch Municipality, (undated) Cloetesville 1 and Cloetesville 2 GIS maps.
- 13
- 14Stellenbosch Municipality, (undated) Klapmuts GIS map
- 15Steyn, D and Mokoena, V 2022 Stellenbosch backyarders threaten to occupy golf course, Groundup.
- 16Available municipal and municipal-commissioned survey evidence identifies at least 3,585 backyard residential households/dwellings in Kayamandi, Klapmuts and Idas Valley alone. Because this subtotal excludes unquantified backyard dwellings in Cloetesville/Smartie Town, Groendal/Mooiwater and other lower-income areas, this is a conservative working estimate pending access to the Cloetesville and Groendal survey data. The strongest evidence is the following. Stellenbosch Municipality, 2021 2020/21 Annual Report, pages 216 and 217 (Table 150 – Kayamandi: 1 629 backyard households; Table 151 – Klapmuts: 1 626 backyard households); and, Stellenbosch Human Settlements Committee Meeting, 2019 Demographic Survey of Backyard Dwellers of Idas Valley, page 76 (330 Idas Valley informal backyard structures surveyed).
- 17Gunter, A 2014 Renting shacks: Landlords and tenants in the informal housing sector in Johannesburg South Africa, University of South Africa.
- 18Sithole, SK 2025 Informal enterprise incubation in newly established informal settlements and its interaction with regulatory urban planning practice and retail by-laws: The case of Azania settlement in Kayamandi, Stellenbosch, University of Stellenbosch. (The information was retrieved during the preparation of this report and incorporated into the analytical tables. At the time of final editing the Stellenbosch University site was temporarily inaccessible and therefore the information could not be re-verified online).
- 19The evidentiary chain for the estimate of free-standing informal settlement structures municipality-wide is inferential and cumulative rather than derived from a single official enumeration. The estimate was constructed by combining direct settlement-specific household estimates (as proxy for number of structures), later growth indicators, municipal/NGO references to additional smaller settlements, and evidence of continued settlement expansion. The strongest identifiable evidentiary components are the following.
• Swilling, et al, 2013 Rethinking Incremental Urbanism: co-production of incremental informal settlement upgrading strategies, page 4 (2 400 households in Enkanini);
• Reyneke, et al, 2019 Domestic Rainwater Harvesting: Exploring user perceptions, attitudes and water uses at Enkanini informal settlement, Stellenbosch, Water Research Commission, page 4 (4 449 households in Enkanini);
• Stellenbosch municipality, 2022 B/SM 17/23: Electrification of informal houses in the Enkanini informal settlement of Stellenbosch for the period ending 30 June 2024 (this does not provide a structure count, but confirms the continuing scale, permanence, and infrastructural significance of the Enkanini settlement);
• Stellenbosch Municipality/Community Organisation Resource Centre (CORC), 2011 Langrug Settlement Enumeration Report, page 3 (almost 1 800 families);
• Langrug Community, CORC, Informal Settlements Network, SA Shackdwellers International and Stellenbosch Municipality, 2015 ‘this is my slum’ The Upgrading of Langrug (1 900 households);
• Isidima, 2018 Innovating sanitation provision to informal settlements (2 500 households in Langrug Informal Settlement, demonstrating substantial growth beyond earlier enumeration figures);
• DAG, 2023 Asivikelane submission of inputs for Stellenbosch Municipality’s Draft 2023/24 Budget, page 3 (refers to Enkanini, Langrug, Azania and at least four other smaller informal settlements, but these smaller settlements were not individually enumerated in publicly accessible sources).
• It was assumed that Azania could have as many as 1 000 units and between the remaining settlements there could be a further 1 000 units.
Adding the highest estimates of household numbers as a proxy for informal structures yields a total of about 9 000 units in free standing informal settlements. - 20Swilling, M et al 2013 Rethinking Incremental Urbanism: co-production of incremental informal settlement upgrading strategies (Enkanini informal settlement discussion paper), especially pp. 4-9 for Enkanini household and settlement estimates.
- 21South African SDI Alliance, 2011 Langrug Enumeration Report, especially pp. 5-17 for Langrug household and settlement enumeration data.
- 22
- 23Population estimates for Khayamandi, Cloetesville, Idas Valley and Klapmuts were derived from the Adrian Frith Census 2011 database, which reproduces Statistics South Africa Census 2011 place-level data. The figures were retrieved during the preparation of this report and incorporated into the analytical tables. At the time of final editing the Adrian Frith site was temporarily inaccessible and therefore the figures could not be re-verified online. The figures should therefore be treated as Census-2011-derived estimates pending confirmation from Stats SA Community Profiles or SuperCROSS outputs.
- 24Growth factor: 1,126 derived from Stellenbosch municipal population growth from 155,733 (2011) to 175,411 (2022). Cf. Wikipedia, (undated) Stellenbosch local municipality – sub-heading: Demographics.
- 25Frith, A (undated) Khayamandi population.
- 26Frith, A (undated) Cloetesville population.
- 27Frith, A (undated) Idas Valley Population.
- 28Frith, A (undated) Klapmuts population.
- 29Changeability, (undated) The Communities we serve.
- 30Assuming one household per informal structure.
- 31Assuming four persons per household.
- 32Notes on assumptions and the 20m² adequacy benchmark:
*Formal township housing units are assumed to average 55m². This reflects the likelihood that many older formal township houses have been extended over time, while some newer RDP/BNG-type units remain closer to 40m². The 55m² figure is therefore used as an analytical average for formal housing stock.
*Backyard structures and free-standing informal settlement structures are assumed to average 40m². This is deliberately generous for informal structures and therefore likely understates, rather than overstates, actual overcrowding.
*World Health Organisation (WHO) recognises floor area per person as one legitimate measure of household crowding. Cf. WHO Housing and Health Guidelines, Chapter 3: Household crowding. WHO does not prescribe a universal floor-space threshold, but it explicitly recognises crowding as a condition where occupants exceed the dwelling space available, including as measured by floor area.
*Housing-health literature associated with the WHO housing-health field identifies floor-area crowding thresholds around 20m² per person, including less than 20m² per person in Germany, less than 21m² per capita in Russia, and Polish categories below 10m² and above 20m² per person. Cf. Lorentzen, JC Johanson, G Björk, F and Stensson, S 2022 “Overcrowding and Hazardous Dwelling Condition Characteristics: A Systematic Search and Scoping Review of Relevance for Health.” International Journal of Environmental Research and Public Health, 19(23), 15542. See the review of crowding definitions and thresholds, Table 2B.
WHO recognises floor area as one measure of crowding and recommends that implementing agencies select context-appropriate crowding measures and thresholds.
*Statistics Sweden, “Sociodemographic inequalities in Sweden”, gives the clearest official threshold: it defines residential overcrowding as living with less than 20m² per person. Statistics Sweden. “Sociodemographic inequalities in Sweden.”
*This study therefore adopts 20m² per person as an adequacy benchmark for estimating the scale of floor-space deficit. - 33Note on data sources: Population, formal-unit, backyard-unit and informal-settlement-unit figures are drawn from Tables 1-3 of the paper and are not re-referenced here. New source references are provided only for the 20m² per-person benchmark and the measurement method for crowding.
- 34Calculation method: Floor area equals units multiplied by the assumed average unit size.
- 35Calculation method: Occupational density equals total floor area divided by population.
- 36Calculation method: Additional 40m² units required are calculated as ((population x 20m²) minus current floor area) divided by 40m², rounded up to the nearest whole unit. The total additional-unit figure is the sum of the row-level requirements, which preserves the separate housing-category calculations.
- 37UN-Habitat/UN Statistics Division, 2021 SDG Indicator 11.1.1 metadata, p. 9 on overcrowding and minimum living area; see also WHO Housing and Health Guidelines, Chapter 3 on household crowding.
- 38Not in my backyard describes a suburban practice of resisting proximate lower income affordable residential developments, based on a perception of that such developments pose a risk to existing property values.
- 39Hendler, P 2019, personal notes of Onderpapegaaiberg residents meeting concerning the Adam Tas Corridor, Droe Dyke and affordable housing proposals. Personal notes, unpublished, no page pagination.
- 40Stellenbosch Municipality, 2019, Municipal Spatial Development Framework, pp. 187-191 on comments and responses concerning Droe Dyke, agricultural research objections and the municipality’s response that the area was well situated for housing.
Latest Articles

Emerging consensus of the Usindiso tragedy
Preface: News reporting functions to develop emerging consensus about the meaning of news events. In an earlier article I explored ways in which the...

Invade and settle on land: class struggle over housing shortages
Preface This article reflects the implications of people who invade and settle on land. In November 2021 my colleagues at Stellenbosch Transparency,...

News reporting connotations of burning building
By Paul Hendler, Stellenbosch Transparency.I reflect on the news reporting connotations by three news publishers, The South African, Eye Witness...
Recent Posts

Emerging consensus of the Usindiso tragedy

Invade and settle on land: class struggle over housing shortages

News reporting connotations of burning building

Crime and evidence

Enclosure mentalities: safety, information

Stop-and-frisk harassment

Adequate housing essential for decent quality of life!

Struggle for Decent and Affordable Homes

Right to Demand Adequate Housing

‘Othering’ men, women and children must stop!

Democracy and hearing different narratives (2)

Democratic systems, hearing different stories (1)

Conflicting opinions overcome by practical agreements

Objective information on crime

Crime incidents – using the data

Ways of seeing crime and fencing
- 1Development Action Group, 2025 Stellenbosch’s Inclusionary Zoning Policy: Lessons and Insights on Policy Development, pp. 2-4 on policy parameters; pp. 17-22 on the Adam Tas Corridor and land value capture; pp. 35-47 on adoption, implementation and monitoring.
- 2First Home Finance is the South African government subsidy for first-time buyers.
- 3Western Cape Government/Centre for Affordable Housing Finance in Africa, 2022 Stellenbosch Town Housing Market Study (STHMS). The percentages of households within broad income bands are derived from the comparative household-income distributions presented on page 63 of the STHMS, which compares estimates from GeoTerraImage (GTI) and the Western Cape Department of Economic Development and Tourism (WC DEDT). The STHMS itself defines the housing market price bands on page 54.
- 4This table aligns the income-distribution structures from the STHMS as closely as possible with analytically inferred affordability thresholds derived from standard mortgage affordability assumptions. The inferred affordability thresholds were based on the following assumptions:• Mortgage repayment period: 20 years;
• Interest rate: approximately prime-linked mortgage rates prevailing around the period of the STHMS;
• Maximum repayment-to-income ratio: approximately 30 per cent of gross monthly household income;
• Deposit assumption: approximately 10 per cent;
• Transfer costs excluded from the initial threshold calculations.Using these assumptions, approximate monthly household incomes required to access the various market segments were inferred from the housing price bands defined in the STHMS. Because the income-band categories used in the GTI and WC DEDT datasets do not correspond perfectly with the analytically inferred affordability thresholds, the two structures were aligned as closely as possible. The resulting percentages and household estimates should therefore be understood as approximations derived through analytical alignment rather than directly observed Census categories. - 5See footnote 1
- 6Spatial concentrations are based on the author’s knowledge of the housing market segments in these areas. South African Affordable Residential Developers Association (SAARDA), 2023 Largest development launched as first urban inclusionary initiative in Stellenbosch, refers to Newinbosch inclusionary housing implementation and pricing.
- 7Reconstruction and Development Programme 40 square metre units, over 2 million of which were delivered between 1994 and 2020, fully subsidised by government.
- 8Breaking New Ground was the name of the new housing policy adopted in 2004 to address shortcomings of the initial RDP programme, and the units built to a higher level of finishing were referred to as BNG units.
- 9A significant number of these households are residing in informal structures (see Table 2).
- 10Stellenbosch Municipality, (undated) Groendal GIS cadastral map.
- 11Stellenbosch Municipality, (undated) Khayamandi 1 and Khayamandi 2 GIS maps.
- 12Stellenbosch Municipality, (undated) Cloetesville 1 and Cloetesville 2 GIS maps.
- 13
- 14Stellenbosch Municipality, (undated) Klapmuts GIS map
- 15Steyn, D and Mokoena, V 2022 Stellenbosch backyarders threaten to occupy golf course, Groundup.
- 16Available municipal and municipal-commissioned survey evidence identifies at least 3,585 backyard residential households/dwellings in Kayamandi, Klapmuts and Idas Valley alone. Because this subtotal excludes unquantified backyard dwellings in Cloetesville/Smartie Town, Groendal/Mooiwater and other lower-income areas, this is a conservative working estimate pending access to the Cloetesville and Groendal survey data. The strongest evidence is the following. Stellenbosch Municipality, 2021 2020/21 Annual Report, pages 216 and 217 (Table 150 – Kayamandi: 1 629 backyard households; Table 151 – Klapmuts: 1 626 backyard households); and, Stellenbosch Human Settlements Committee Meeting, 2019 Demographic Survey of Backyard Dwellers of Idas Valley, page 76 (330 Idas Valley informal backyard structures surveyed).
- 17Gunter, A 2014 Renting shacks: Landlords and tenants in the informal housing sector in Johannesburg South Africa, University of South Africa.
- 18Sithole, SK 2025 Informal enterprise incubation in newly established informal settlements and its interaction with regulatory urban planning practice and retail by-laws: The case of Azania settlement in Kayamandi, Stellenbosch, University of Stellenbosch. (The information was retrieved during the preparation of this report and incorporated into the analytical tables. At the time of final editing the Stellenbosch University site was temporarily inaccessible and therefore the information could not be re-verified online).
- 19The evidentiary chain for the estimate of free-standing informal settlement structures municipality-wide is inferential and cumulative rather than derived from a single official enumeration. The estimate was constructed by combining direct settlement-specific household estimates (as proxy for number of structures), later growth indicators, municipal/NGO references to additional smaller settlements, and evidence of continued settlement expansion. The strongest identifiable evidentiary components are the following.
• Swilling, et al, 2013 Rethinking Incremental Urbanism: co-production of incremental informal settlement upgrading strategies, page 4 (2 400 households in Enkanini);
• Reyneke, et al, 2019 Domestic Rainwater Harvesting: Exploring user perceptions, attitudes and water uses at Enkanini informal settlement, Stellenbosch, Water Research Commission, page 4 (4 449 households in Enkanini);
• Stellenbosch municipality, 2022 B/SM 17/23: Electrification of informal houses in the Enkanini informal settlement of Stellenbosch for the period ending 30 June 2024 (this does not provide a structure count, but confirms the continuing scale, permanence, and infrastructural significance of the Enkanini settlement);
• Stellenbosch Municipality/Community Organisation Resource Centre (CORC), 2011 Langrug Settlement Enumeration Report, page 3 (almost 1 800 families);
• Langrug Community, CORC, Informal Settlements Network, SA Shackdwellers International and Stellenbosch Municipality, 2015 ‘this is my slum’ The Upgrading of Langrug (1 900 households);
• Isidima, 2018 Innovating sanitation provision to informal settlements (2 500 households in Langrug Informal Settlement, demonstrating substantial growth beyond earlier enumeration figures);
• DAG, 2023 Asivikelane submission of inputs for Stellenbosch Municipality’s Draft 2023/24 Budget, page 3 (refers to Enkanini, Langrug, Azania and at least four other smaller informal settlements, but these smaller settlements were not individually enumerated in publicly accessible sources).
• It was assumed that Azania could have as many as 1 000 units and between the remaining settlements there could be a further 1 000 units.
Adding the highest estimates of household numbers as a proxy for informal structures yields a total of about 9 000 units in free standing informal settlements. - 20Swilling, M et al 2013 Rethinking Incremental Urbanism: co-production of incremental informal settlement upgrading strategies (Enkanini informal settlement discussion paper), especially pp. 4-9 for Enkanini household and settlement estimates.
- 21South African SDI Alliance, 2011 Langrug Enumeration Report, especially pp. 5-17 for Langrug household and settlement enumeration data.
- 22
- 23Population estimates for Khayamandi, Cloetesville, Idas Valley and Klapmuts were derived from the Adrian Frith Census 2011 database, which reproduces Statistics South Africa Census 2011 place-level data. The figures were retrieved during the preparation of this report and incorporated into the analytical tables. At the time of final editing the Adrian Frith site was temporarily inaccessible and therefore the figures could not be re-verified online. The figures should therefore be treated as Census-2011-derived estimates pending confirmation from Stats SA Community Profiles or SuperCROSS outputs.
- 24Growth factor: 1,126 derived from Stellenbosch municipal population growth from 155,733 (2011) to 175,411 (2022). Cf. Wikipedia, (undated) Stellenbosch local municipality – sub-heading: Demographics.
- 25Frith, A (undated) Khayamandi population.
- 26Frith, A (undated) Cloetesville population.
- 27Frith, A (undated) Idas Valley Population.
- 28Frith, A (undated) Klapmuts population.
- 29Changeability, (undated) The Communities we serve.
- 30Assuming one household per informal structure.
- 31Assuming four persons per household.
- 32Notes on assumptions and the 20m² adequacy benchmark:
*Formal township housing units are assumed to average 55m². This reflects the likelihood that many older formal township houses have been extended over time, while some newer RDP/BNG-type units remain closer to 40m². The 55m² figure is therefore used as an analytical average for formal housing stock.
*Backyard structures and free-standing informal settlement structures are assumed to average 40m². This is deliberately generous for informal structures and therefore likely understates, rather than overstates, actual overcrowding.
*World Health Organisation (WHO) recognises floor area per person as one legitimate measure of household crowding. Cf. WHO Housing and Health Guidelines, Chapter 3: Household crowding. WHO does not prescribe a universal floor-space threshold, but it explicitly recognises crowding as a condition where occupants exceed the dwelling space available, including as measured by floor area.
*Housing-health literature associated with the WHO housing-health field identifies floor-area crowding thresholds around 20m² per person, including less than 20m² per person in Germany, less than 21m² per capita in Russia, and Polish categories below 10m² and above 20m² per person. Cf. Lorentzen, JC Johanson, G Björk, F and Stensson, S 2022 “Overcrowding and Hazardous Dwelling Condition Characteristics: A Systematic Search and Scoping Review of Relevance for Health.” International Journal of Environmental Research and Public Health, 19(23), 15542. See the review of crowding definitions and thresholds, Table 2B.
WHO recognises floor area as one measure of crowding and recommends that implementing agencies select context-appropriate crowding measures and thresholds.
*Statistics Sweden, “Sociodemographic inequalities in Sweden”, gives the clearest official threshold: it defines residential overcrowding as living with less than 20m² per person. Statistics Sweden. “Sociodemographic inequalities in Sweden.”
*This study therefore adopts 20m² per person as an adequacy benchmark for estimating the scale of floor-space deficit. - 33Note on data sources: Population, formal-unit, backyard-unit and informal-settlement-unit figures are drawn from Tables 1-3 of the paper and are not re-referenced here. New source references are provided only for the 20m² per-person benchmark and the measurement method for crowding.
- 34Calculation method: Floor area equals units multiplied by the assumed average unit size.
- 35Calculation method: Occupational density equals total floor area divided by population.
- 36Calculation method: Additional 40m² units required are calculated as ((population x 20m²) minus current floor area) divided by 40m², rounded up to the nearest whole unit. The total additional-unit figure is the sum of the row-level requirements, which preserves the separate housing-category calculations.
- 37UN-Habitat/UN Statistics Division, 2021 SDG Indicator 11.1.1 metadata, p. 9 on overcrowding and minimum living area; see also WHO Housing and Health Guidelines, Chapter 3 on household crowding.
- 38Not in my backyard describes a suburban practice of resisting proximate lower income affordable residential developments, based on a perception of that such developments pose a risk to existing property values.
- 39Hendler, P 2019, personal notes of Onderpapegaaiberg residents meeting concerning the Adam Tas Corridor, Droe Dyke and affordable housing proposals. Personal notes, unpublished, no page pagination.
- 40Stellenbosch Municipality, 2019, Municipal Spatial Development Framework, pp. 187-191 on comments and responses concerning Droe Dyke, agricultural research objections and the municipality’s response that the area was well situated for housing.
0 Comments